Western U.S. hourly electric power supply: June 28 - July 4, 2026
Distribution powerline at Rico, Colorado
Linecurrents photo
by Allyn Svoboda
November 11, 2019
by Allyn Svoboda
July 14, 2026
updated July 20, 2026
U.S. Energy Information Administration (EIA) Hourly Electric Grid Monitor is the source for data for this report. EIA provides this disclaimer:
Disclaimer: The information submitted by reporting entities is preliminary data and is made available "as-is" by EIA. Neither EIA nor reporting entities are responsible for reliance on the data for any specific use.
Charts below created from data downloads of Hourly Grid Monitor for EIA Northwest, Southwest and California regions, (see map at end of report). These regions comprise the U.S Western electric system interconnection.
…………….…
[above charts] U.S. Western Interconnection electric generation from all energy sources, June 28 - July 4, 2026. Linecurrents.live charts, U.S. Energy Information Administration (EIA) Hourly Electric Grid Monitor data.
Non-combustion generation results
Hydroelectric dams and solar energy contributed the largest individual shares of electric generation in the Western Interconnection for the week beginning June 28, 2026.
Non-combustion energy sources - wind, solar, nuclear, geothermal and hydroelectric - combined supplied 72.34% of total electric power generated.
Solar generation 65,000 to 75,000 MWhr per hour during peak-sun hours 10 AM to 6 PM Pacific time. Maximum hourly production of nearly 80,000 MWhr late afternoon June 30.
Wind
fairly stable all week - most hours
Hydroelectric
increases in early evenings to compensate for loss of solar generation and evening increase in electric consumers’ demand.
Nuclear
constant production
Geothermal
constant production
Hourly electric generation by type for each day
Daily charts for the week beginning June 28, 2025 show hourly totals of:
U.S. Energy Information Administration (EIA) non-combustion electric generating categories.
total of all electric energy sources, including combustion.
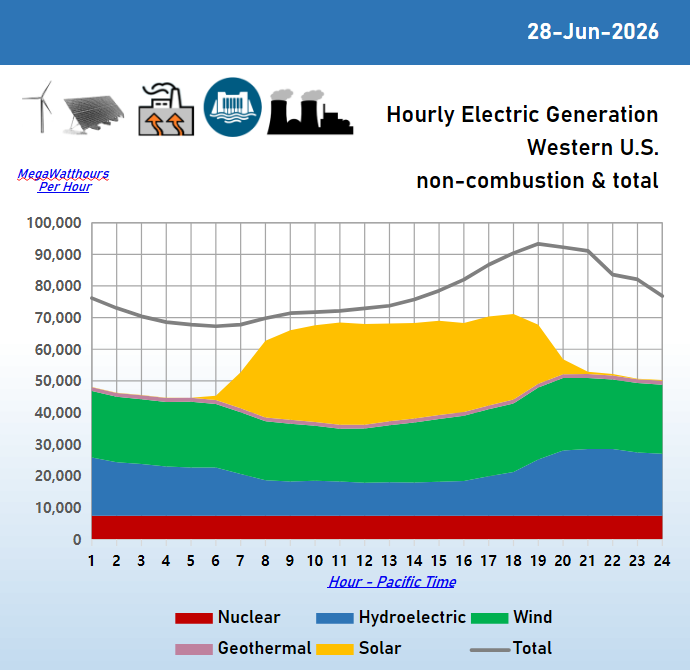
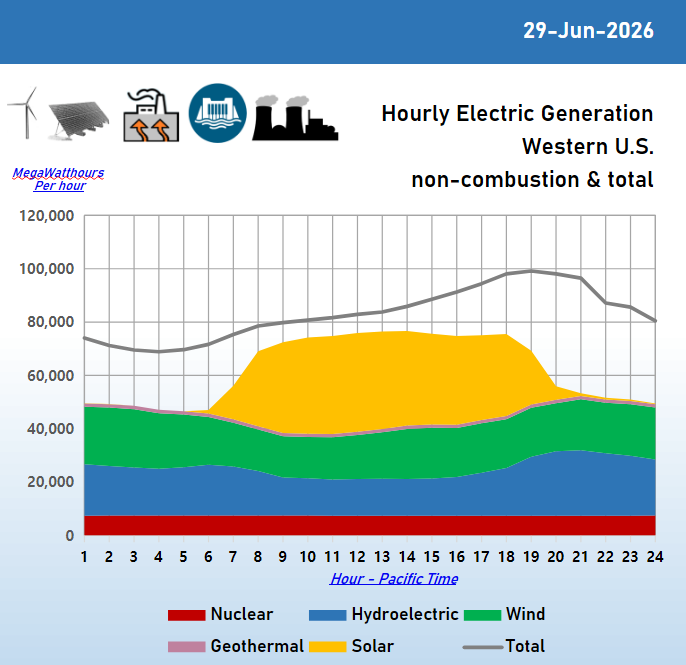
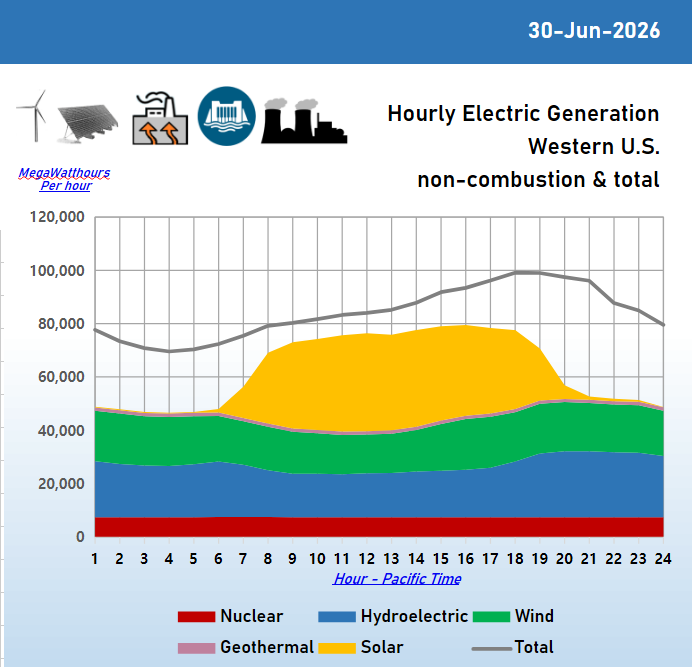
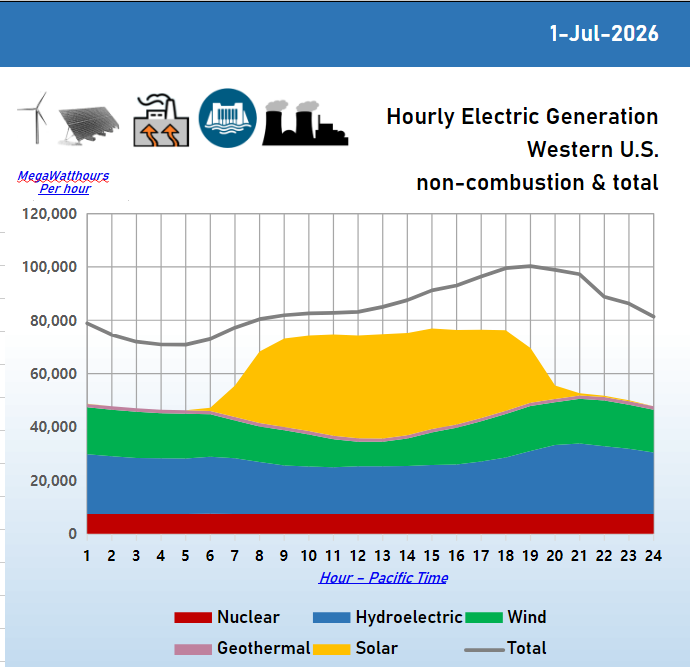
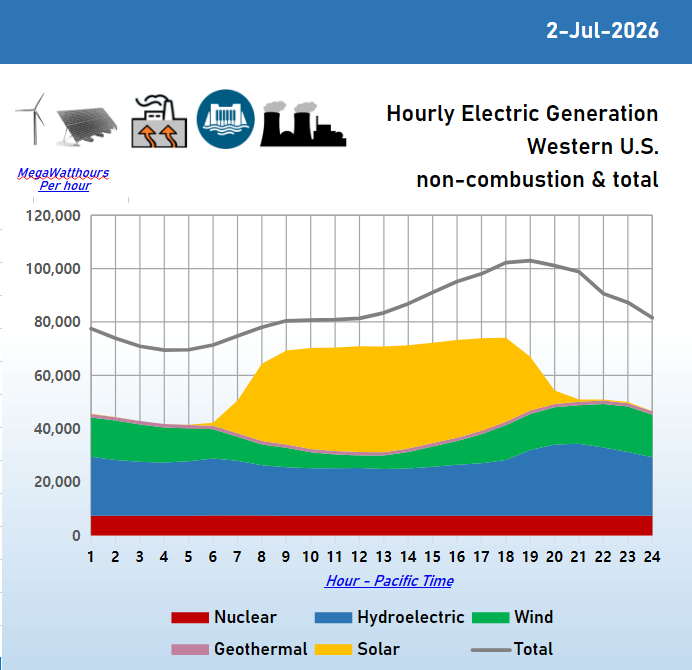
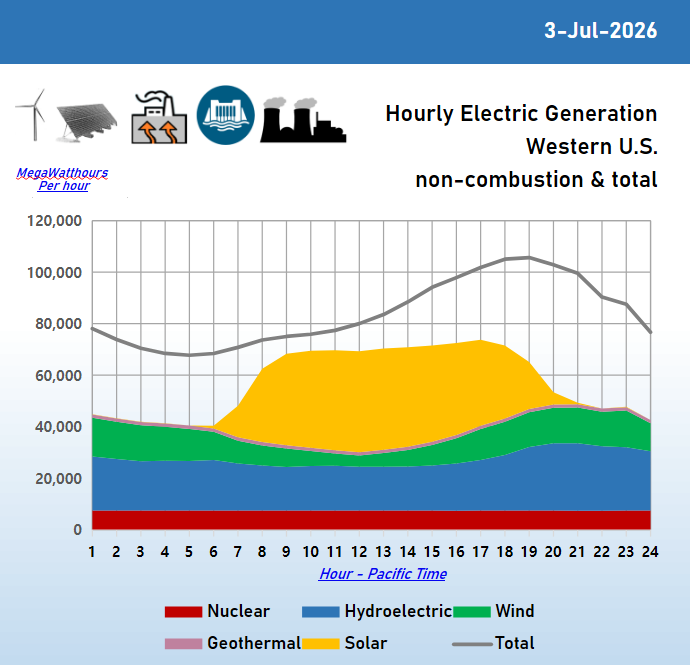
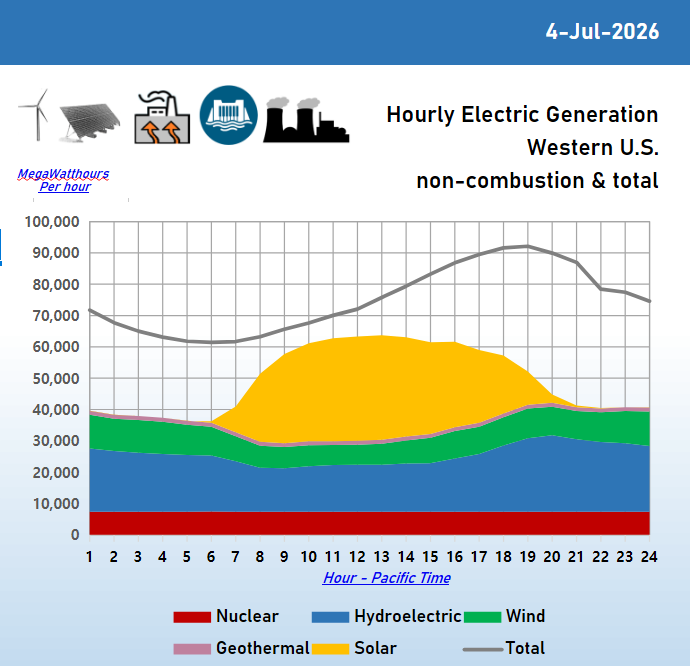
Linecurrents charts created from U.S. Energy Information Administration (EIA) data.
EIA collects and displays standalone hourly battery energy storage megaWatt-hours. Standalone battery energy is not shown in this report because:
battery energy storage systems (BESS) do not generate (produce) electricity.
hourly values are negative (-) when absorbing power from other electric generating sources delivered by the electric transmission or distribution system, and positive (+) when releasing stored energy.
The EIA category for co-located solar with battery systems are included in this report because the solar portion is a generating source.
Some Northwest region data may be missing
Southwest Power Pool (SPP) in the EIA central region and Eastern Interconnection expanded its service area and became the regional transmission organization (RTO) for the areas previously controlled by two Western Area Power Administration (WAPA) balancing authorities regions: Rocky Mountain (WACM) and Upper Great Plains (WAUW). These regions are in the Western Interconnection and EIA Northwest zone.
EIA retired WAPA Rocky Mountain and Upper Great Plains West Balancing Authorities April 1, 2026, according to EIA 930 Reference Tables list of balancing authorities. These two BA’s previously supplied electric houly generation data to EIA Hourly Grid Monitor.
EIA activated Southwest Power Pool West (SWPW) balancing authority on the same date, according the reference tables. However, SWPW did not exist in the Grid Monitor balancing authority selections list at the time of the most update of this report. Therefore, download of data previously supplied by the two WAPA BA’s is not possible
A July 15, 2026 SPP reply to a Linecurrents inquiry describes possible explanations for the inability to retrieve "SPP-West" data from EIA Hourly Grid Monitor.
. . . Yes, SPP is now the balancing authority for your area. On April 1, 2026, the Southwest Power Pool officially expanded into the Western Interconnection, launching the SPP West Balancing Authority Area (SPP West BAA). Regarding why you might not see "SPP West" on the EIA Hourly Grid Monitor: SPP operates as a single, consolidated entity overseeing both its East and West footprints. The EIA likely aggregates all data under the main "SPP" umbrella rather than a standalone "SPP West" label. Alternatively, the EIA may simply not have updated its dropdown menus yet to reflect the April 2026 change.
. . .
Gridinfo.com describes generating capacity for the two WAPA regions:
WAPA Rocky Mountain(link)
Last update June 2026
RANKED#24 out of 64 in terms of net annual generation
STATES
Colorado, Nebraska, New Mexico, North Dakota, South Dakota, Utah, Wyoming
ANNUAL GENERATION
27.6 TWh
POWER PLANTS
192
UTILITIES
101
POWER PLANT TYPES
56.6% Coal
16.4% Water (hydroelectric)
11.9% Wind
9.6% Natural Gas
5.3% Solar
WAPA Upper Great Plains(link)
Last update June 2026
Western Area Power Administration - Upper Great Plains West is ranked #62 out of 64 balancing authorities in terms of total annual electricity generation.
RANKED #62 out of 64 in terms of net annual generation
STATES
Montana, Utah, Wyoming
ANNUAL GENERATION
299.7 GWh
POWER PLANTS
24
UTILITIES
7
POWER PLANT TYPES
99.9% Water (hydroelectric
EIA HOURLY GRID MONITOR DATA REGIONS
United States regions defined by U.S. Energy Information Administration (EIA). Map adapted from U.S. EIA Hourly Electric Grid Monitor. Colors and region labels added by Linecurrents.live.