Western Interconnection hourly electric power supply: 28 Dec 2025 - 3 Jan 2026
Photo by Marco Bicca on Unsplash near Duvall, Washington
February 17, 2021
Note: data source for all charts is the U.S. Energy Information Administration (EIA) Hourly Electric Grid Monitor. See APPENDIX for explanation of data quality.
by Allyn Svoboda
WEEK SUMMARY
…………….…
U.S. Western Interconnection electric generation from all energy sources - December 28, 2025 - January 3, 2026. Linecurrents.live chart, U.S. Energy Information Administration (EIA) Hourly Electric Grid Monitor data.
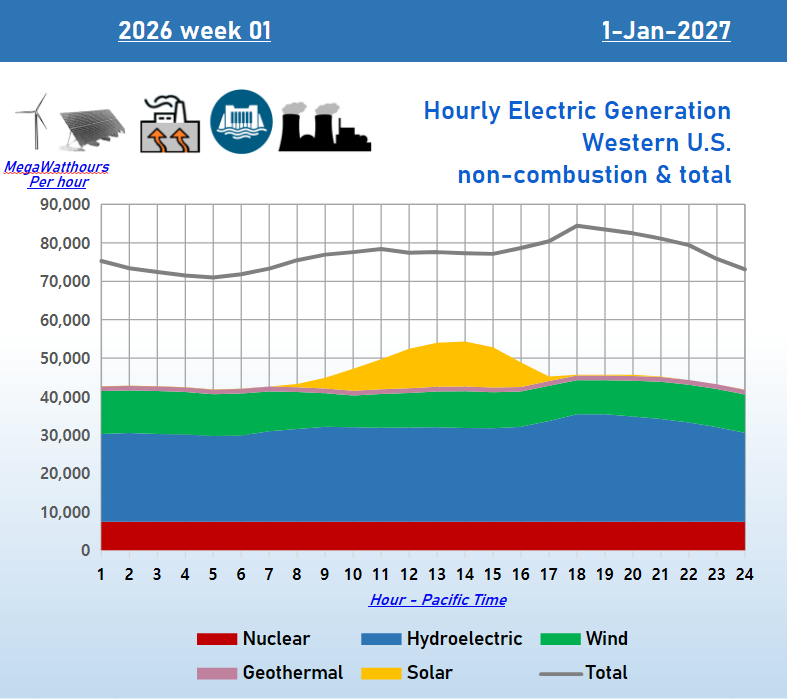
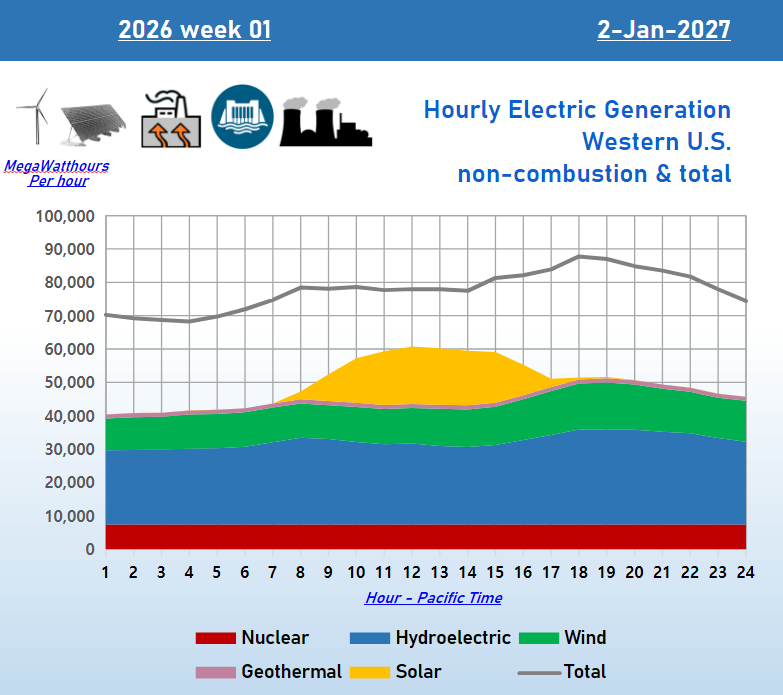
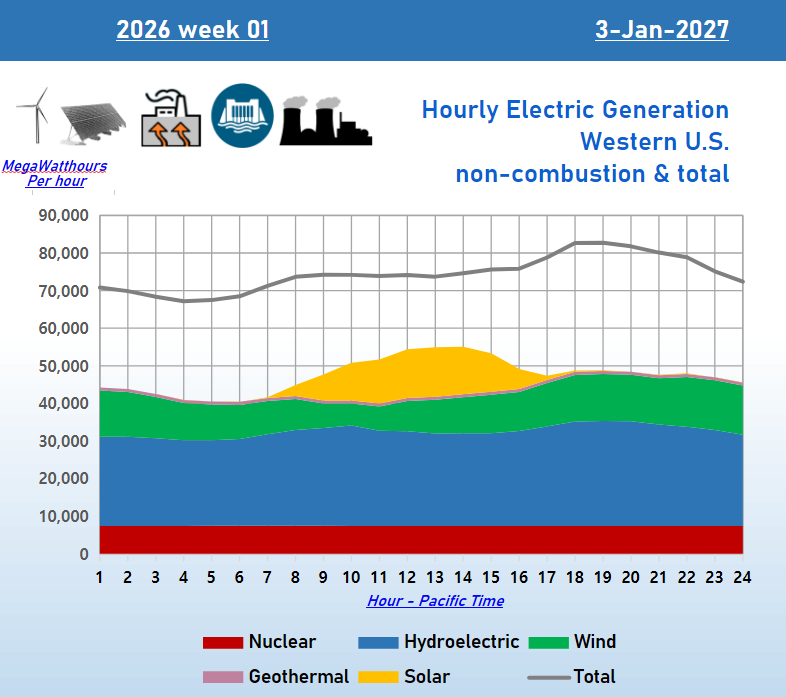
Hydroelectric dams and natural gas combustion contributed the largest individual shares of electric generation in the Western Interconnection for the week beginning December 28, 2025.
Non-combustion energy sources
Wind, solar, nuclear, geothermal and hydroelectric combined supplied 60.4% of total electric power generated.
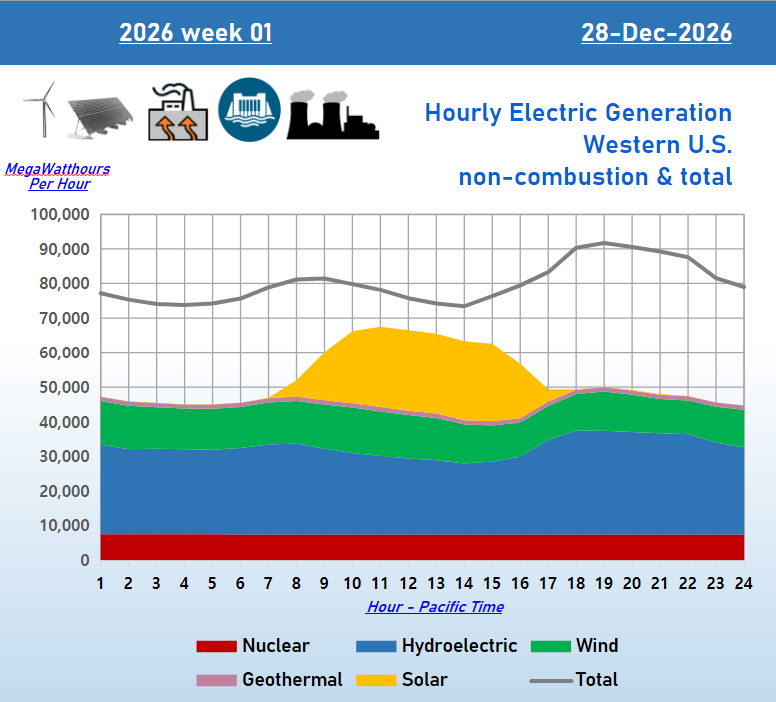
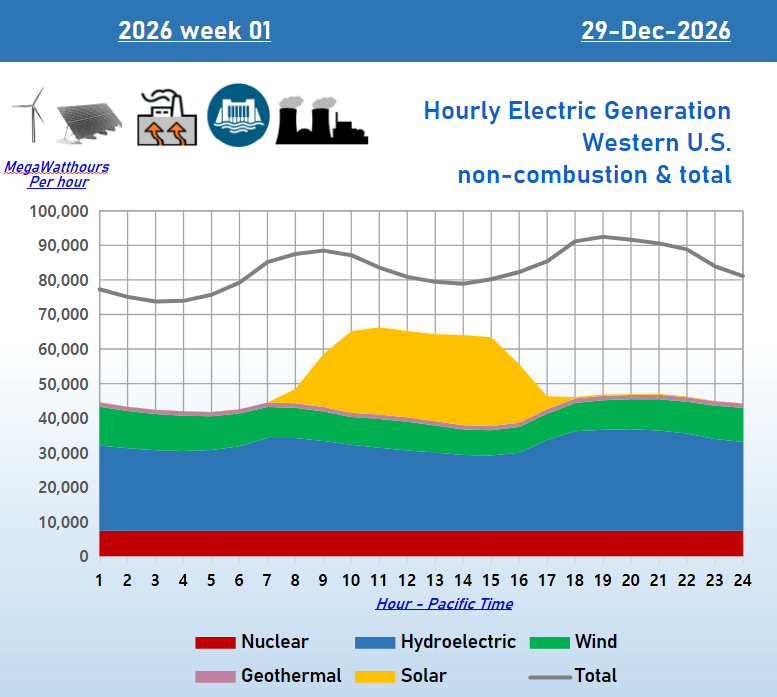
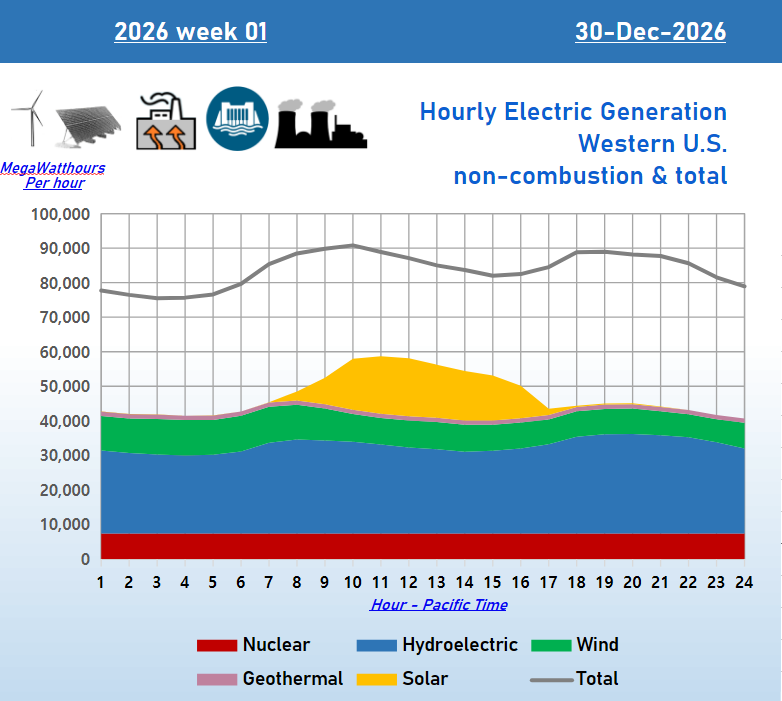
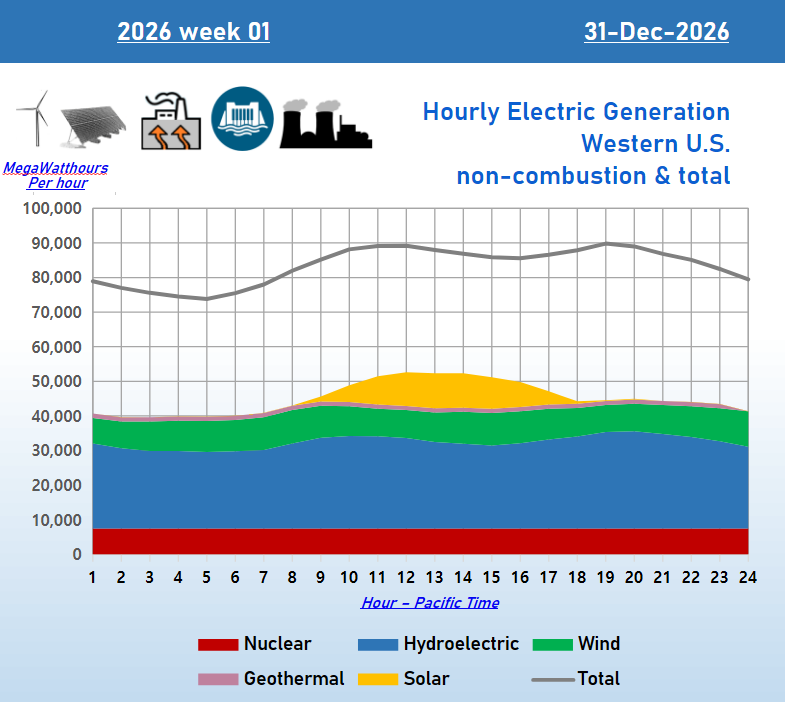
DAILY - HOURLY
Charts for the seven day period beginning December 28, 2025 show hourly totals of:
the five U.S, Energy Information Administration EIA) non-combustion electric generating categories,
total of all electric energy sources, including combustion.
Data is collected by Balancing Authorities within Regions and submitted to EIA.
…………….…
SOLAR
best production December 28 and 29
WIND
fairly stable all week - most hours
HYDROELECTRIC
increases in early evenings to compensate for loss of solar generation and evening increase in electric consumers’ demand.
NUCLEAR
constant production
GEOTHERMAL
constant production
…………….…
Linecurrents.live charts created from U.S. Energy Information Administration (EIA) data.
Appendix
U.S. Energy Information Administration (EIA) Hourly Electric Grid Monitor is the source for data for this report. EIA provides this disclaimer:
Disclaimer: The information submitted by reporting entities is preliminary data and is made available "as-is" by EIA. Neither EIA nor reporting entities are responsible for reliance on the data for any specific use.
United States regions defined by U.S. Energy Information Administration (EIA). Southeast lacks significant windpower generation and is not included in this regional analysis. Map adapted from U.S. EIA Hourly Electric Grid Monitor. Colors and region labels added by Linecurrents.live.