Western U.S. hourly electric power supply: August 9-15, 2026
Non-combustion energy sources - Wind, Solar, Nuclear, Geothermal, Hydroelectric and Other - combined supplied 49.72 % of all electric power generated.
Western U.S. hourly electric power supply: August 2-8, 2026
Non-combustion energy sources - Wind, Solar, Nuclear, Geothermal, Hydroelectric and Other - combined supplied 50.91 % of all electric power generated.
Western U.S. hourly electric power supply: July 26 - August 1, 2026
Non-combustion energy sources - wind, solar, nuclear, geothermal, hydroelectric and other - combined supplied 51.11% of all electric power generated.
Western U.S. hourly electric power supply: July 19 - 25, 2026
Non-combustion energy sources - wind, solar, nuclear, geothermal, hydroelectric and other - produced a combined total of 49.51 % of all electric power generated.
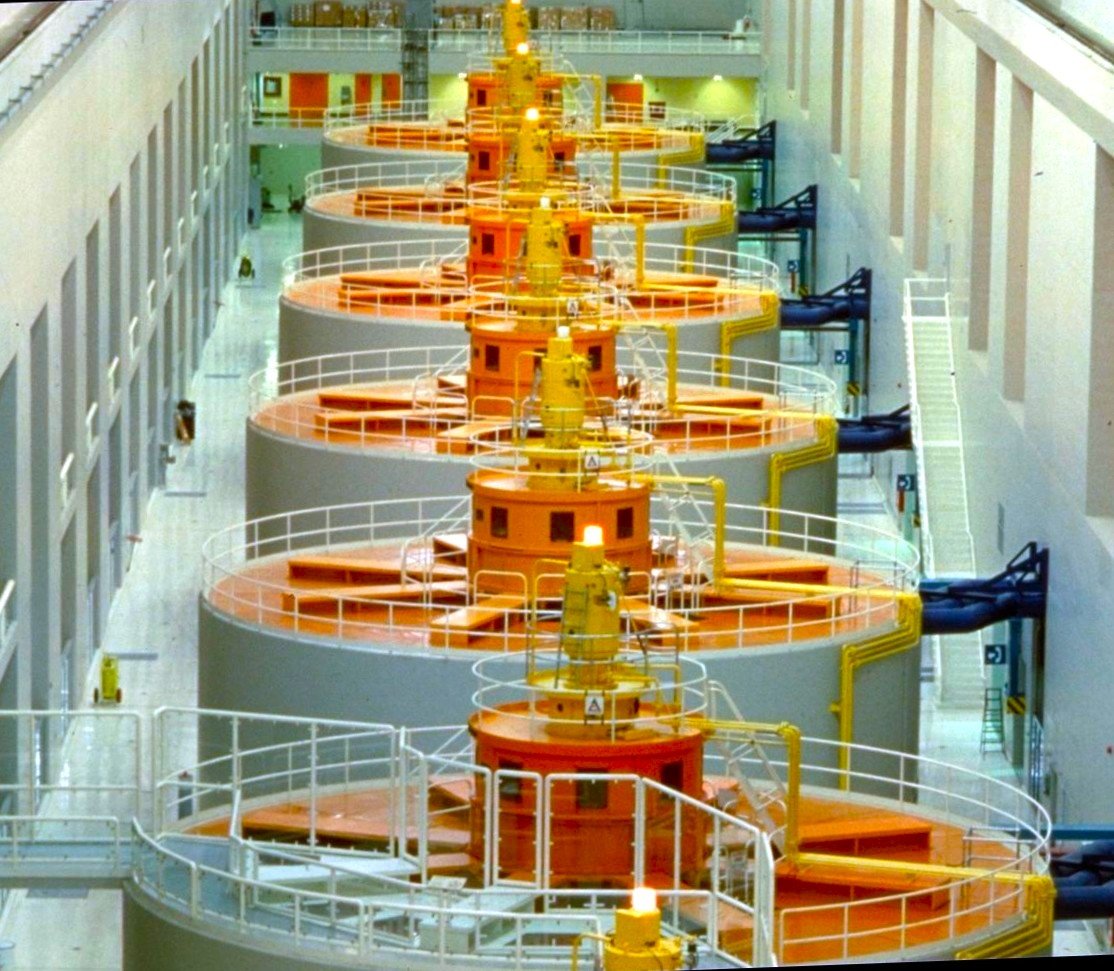
Western U.S. hourly electric power supply: July 12 - 18, 2026
Non-combustion energy sources - wind, solar, nuclear, geothermal hydroelectric and other - combined supplied 8,813,520 MegaWatt-hours (MWhr), 51.95 % of total electric power generated.