Western U.S. hourly electric power supply: July 12 - 18, 2026
Bonneville Dam power house generators. The Bonneville Power Administration is a federal agency that markets and delivers more than half the Pacific Northwest's electricity and maintains a network of more than 12,300 miles of transmission lines.
U.S. Department of Energy photo
at flickr.com
by Allyn Svoboda
August 4, 2026
U.S. Energy Information Administration (EIA) Hourly Electric Grid Monitor is the source for data for this report. EIA provides this regarding accuracy:
Disclaimer: The information submitted by reporting entities is preliminary data and is made available "as-is" by EIA. Neither EIA nor reporting entities are responsible for reliance on the data for any specific use.
Charts below created from data downloads of Hourly Grid Monitor for EIA Northwest, Southwest and California regions These regions comprise the U.S Western electric system interconnection.
…………….…
[above charts]
U.S. Western Interconnection electric generation from all energy sources - July 12-18, 2026.
> Linecurrents.live charts, U.S. Energy Information Administration (EIA) Hourly Electric Grid Monitor data.
Natural gas combustion, hydroelectric dams and solar energy contributed the largest individual shares of electric generation in the Western Interconnection for the week beginning July 12, 2026.
36.0 % natural gas
16.9% hydroelectric
14.9% solar
Non-combustion energy sources - wind, solar, nuclear, geothermal hydroelectric and other - combined supplied 8,813,520 MegaWatt-hours (MWhr), 51.95 % of total electric power generated.
Variable windpower exceeded continuous nuclear power production.
Hourly electric generation by type for each day
DAILY CHARTS below for the week beginning July 12, 2026 show hourly results for:
U.S. Energy Information Administration (EIA) non-combustion electric generating categories - color areas.
total of all electric energy sources, including combustion - gray line.
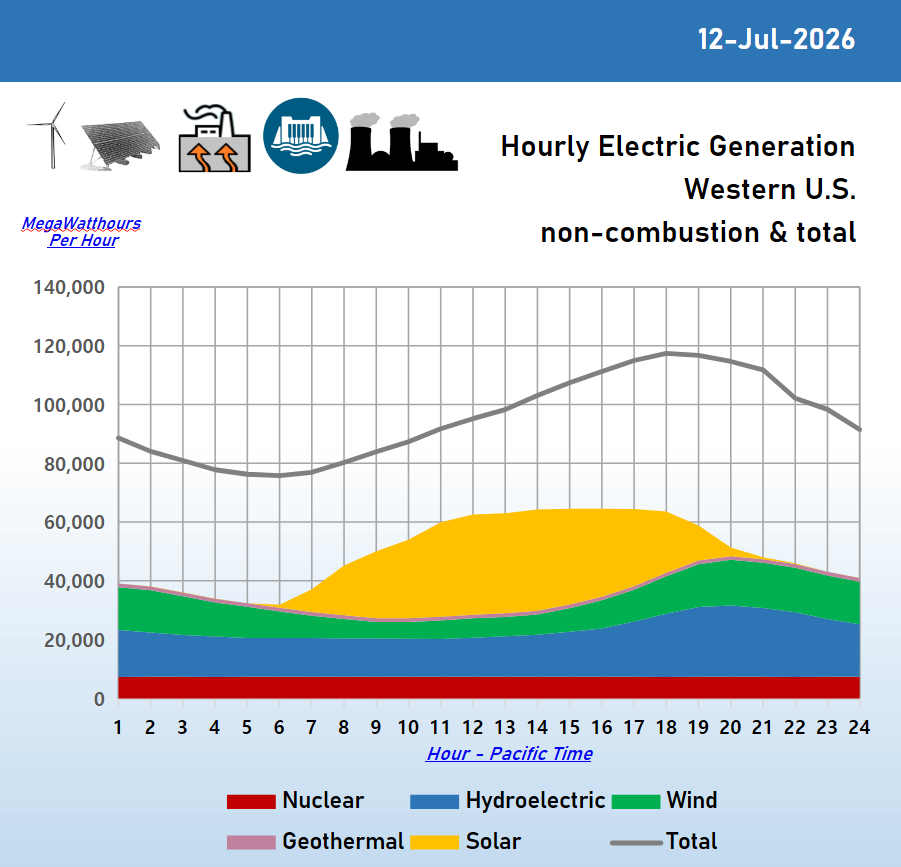
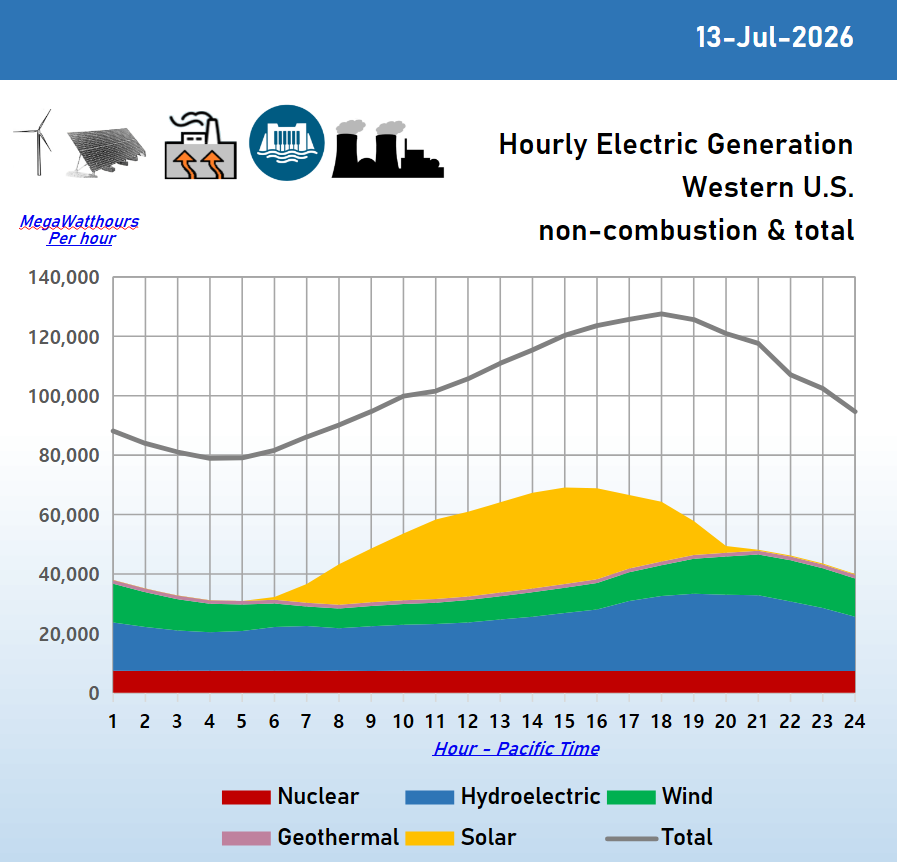
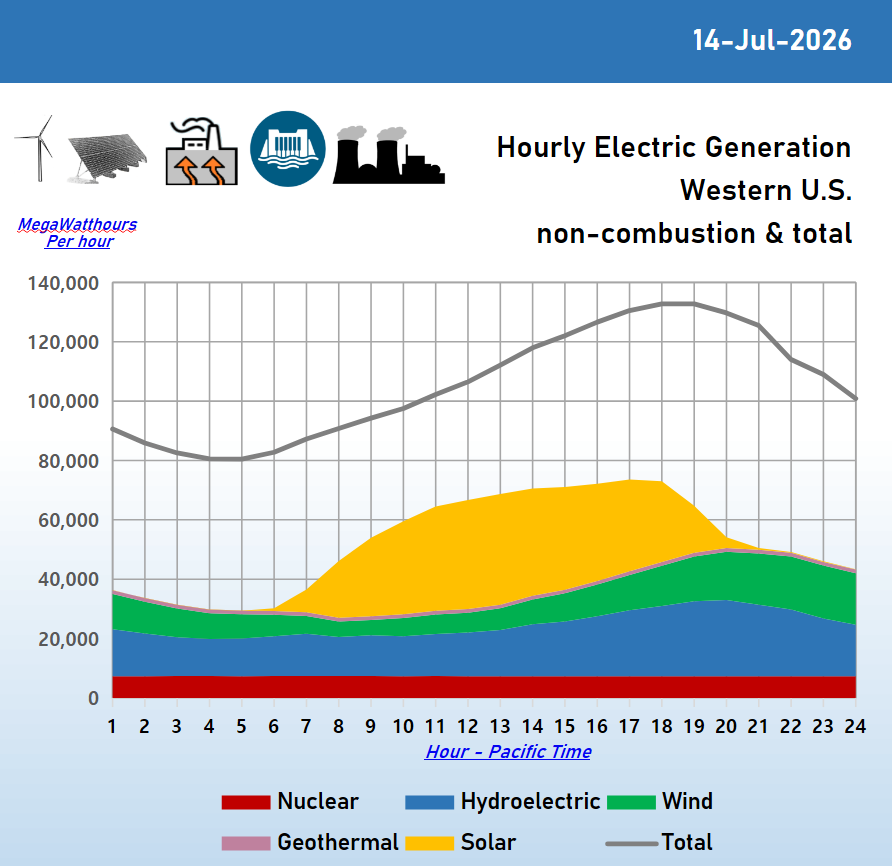
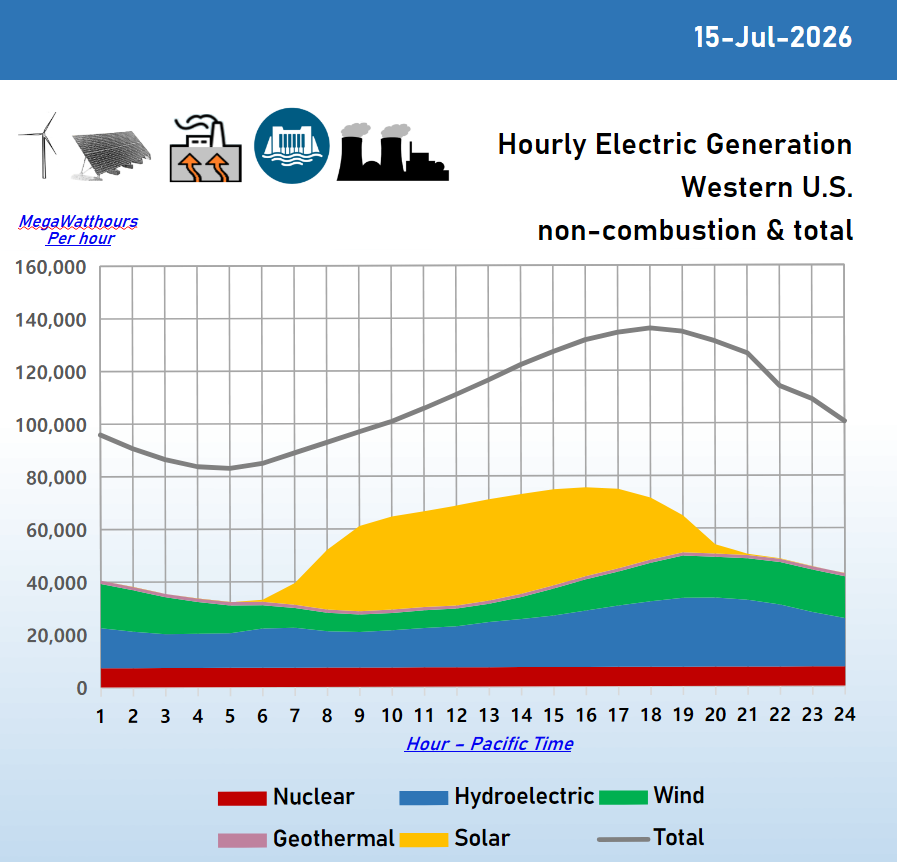
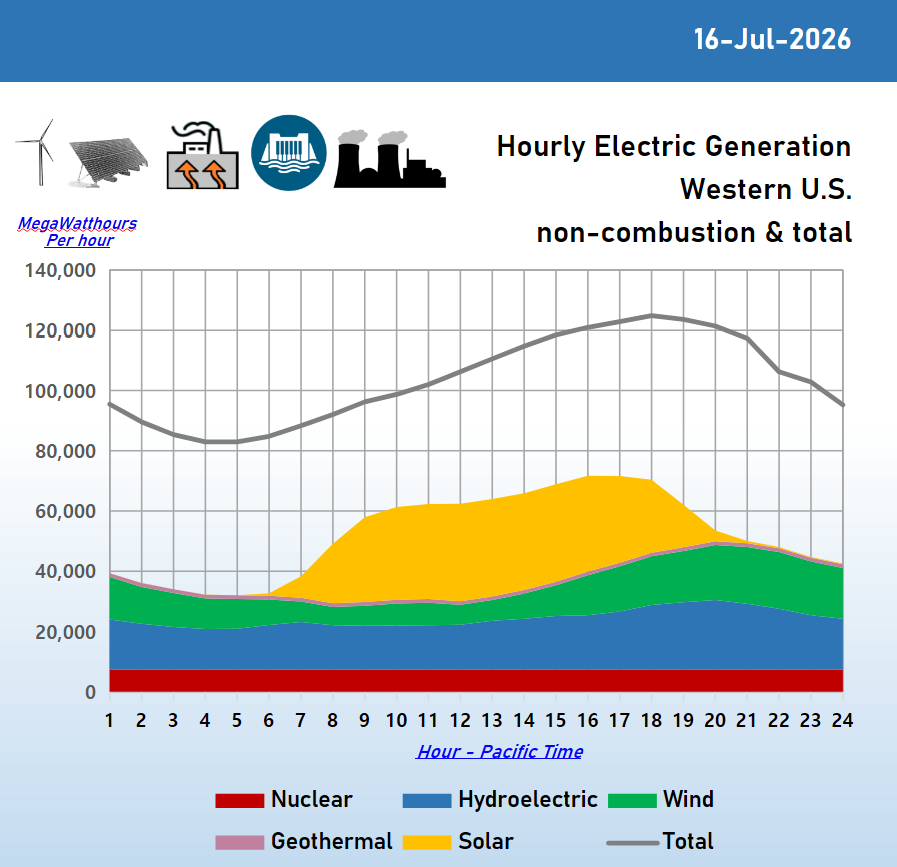
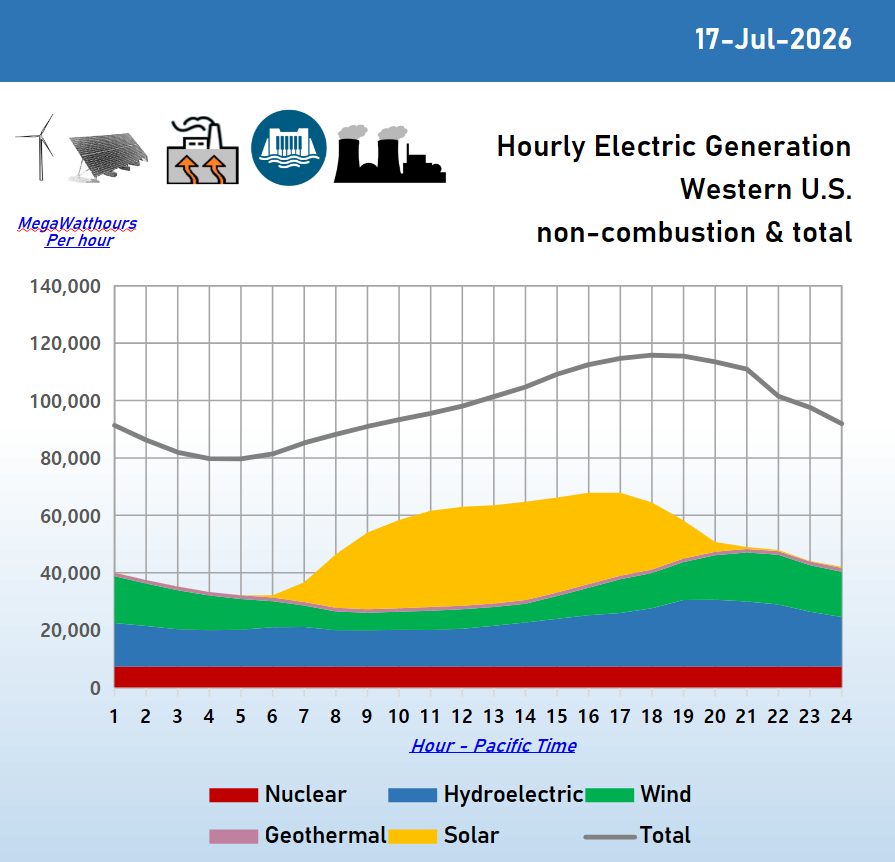
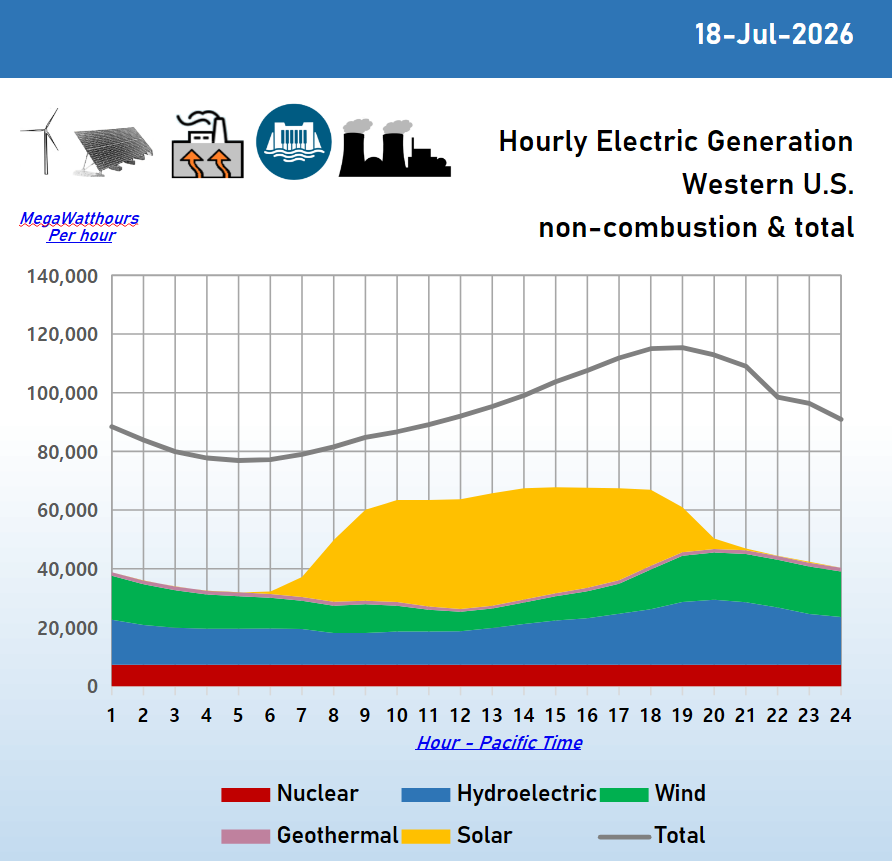
Linecurrents charts created from U.S. Energy Information Administration (EIA) data.
EIA Hourly Grid Monitor provides standalone hourly battery energy storage MegaWatt-hours. Standalone battery energy is not shown in this report because:
battery energy storage systems (BESS) do not generate (produce) electricity.
hourly values are negative (-) when absorbing power from other electric generating sources delivered by the electric transmission or distribution system, and positive (+) when releasing stored energy.
The EIA category for co-located solar with battery systems is included in this report because the solar portion is a generating source.
DAILY TRENDS
24-hour charts above reveal patterns:
Windpower production is less during mid’-day hours, but increases in late afternoon as total production increases to during the evening peak demand.
Solar electric production is consistent during the week.
Hydroelectric increases in early evenings to compensate for loss of solar generation and evening increase in electric consumers’ demand.
Nuclear production varies little.
Geothermal production varies little.
MAXIMUM HOURLY PRODUCTION from variable non-combustion sources:
Solar
38,494 MWhr
hour ending 7/15/2026 1 p.m. PDT
Wind
18,817 MWhr
hour ending 7/16/2026 9 p.m. PDT
Hydroelectric
26,224 MWhr
hour ending 7/15/2026 8 p.m. PDT
HOURLY PRODUCTION from stable non-combustion sources:
Hydroelectric
increases in early evenings to compensate for loss of solar generation and evening increase in electric consumers’ demand.
Nuclear
7,292 - 7,356 MW range for the week.
Geothermal
1,190 - 1,280 MW for the week, except 976 - 998 MW a few hours 7/18/2026.
NOTE
EIA Hourly Grid Monitor provides standalone hourly battery energy storage MegaWatt-hours. Standalone battery energy is not shown in this report because:
battery energy storage systems (BESS) do not generate (produce) electricity.
hourly values are negative (-) when absorbing power from other electric generating sources delivered by the electric transmission or distribution system, and positive (+) when releasing stored energy.
The EIA category for co-located solar with battery systems is included in this report because the solar portion is a generating source.